Energy & National Security
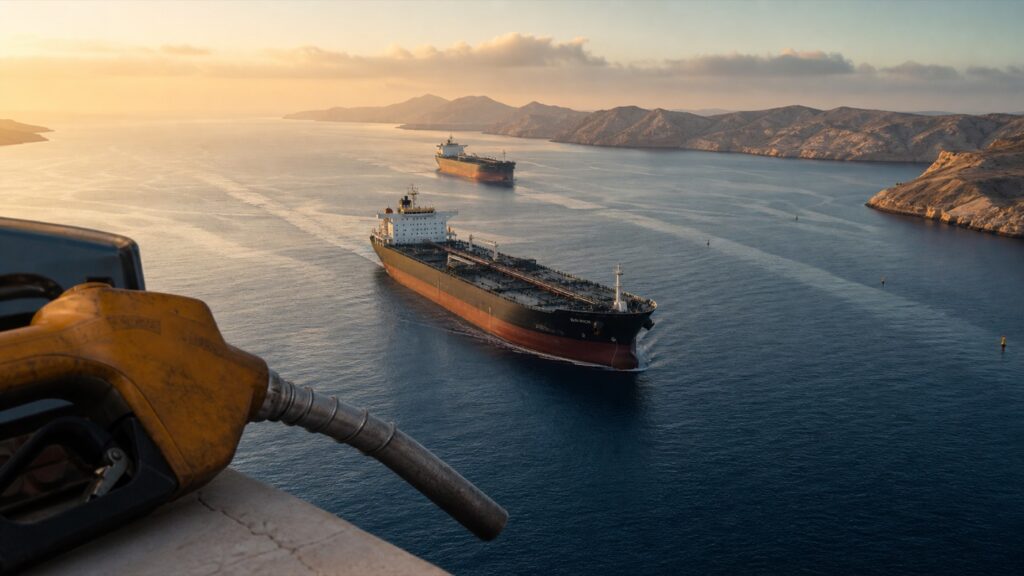
Negotiators may be moving closer to reopening the Strait of Hormuz, but the agreement is not final and Wednesday’s oil-price reversal shows how little certainty the market has. For American drivers, the central question is not whether crude falls for a few hours. It is whether ships can move safely, inventories can rebuild, and lower wholesale costs persist long enough to reach the pump.
The practical conclusion: a durable reopening could reduce the geopolitical premium in oil and create room for gasoline prices to fall later this year. It will not produce instant relief. The national average for regular gasoline was $4.0801 per gallon on August 5—only about one cent below a week earlier and more than 27 cents above a month earlier. Refining margins, fuel inventories, shipping conditions, and local taxes will determine how much of any crude decline reaches households.
What Happened
President Donald Trump said Tuesday evening that an agreement on the Strait of Hormuz could come “tomorrow or the next day” and that progress had been made. The Associated Press reported that talks involving Iran and Oman were exploring separate inbound and outbound shipping routes. The proposed structure was still under negotiation, and regional officials said the final arrangement could change.
Secretary of State Marco Rubio confirmed progress but said there was “not finality yet.” That distinction matters. The United States and Iran reached a memorandum in June intended to restore traffic, but renewed attacks later disrupted the process. Shipping incidents also continued this week. A cargo ship reported damage from an unknown projectile near the Omani port of Al Khasab, while a separate attack was reported in the Red Sea.
Oil prices reflected the uncertainty. AP reported Brent crude down 1.2% at $78.43 per barrel early Wednesday on hopes for a deal. A later market update showed Brent reversing course and rising 1.4% to $80.45. Those moves are snapshots, not closing prices, but the reversal is useful evidence: traders are pricing headlines about route security before they can verify sustained physical flows.
What a Possible Agreement Would—and Would Not—Do
According to AP’s reporting, the proposal under discussion would use an Iranian-controlled route for ships entering the Persian Gulf and an Oman-controlled route for ships leaving it. Officials said service fees could be charged for security and environmental protection. Iran said the talks focused on safe inbound and outbound lanes that also addressed the national-security concerns of Iran and Oman.
That description is not a signed agreement. It leaves unresolved questions about enforcement, inspection, tolls or service fees, the U.S. blockade on Iranian ports, and what happens after another attack. The Trump administration has previously opposed arrangements that would give Iran control over the waterway or permit Iranian tolls. Those policy differences could still alter or derail the framework.
A reopening would also not release a single switch that resets gasoline prices. Crude must be produced, loaded, insured, shipped, refined, transported, and sold. Each stage has its own cost and timing. The Energy Information Administration reported that U.S. gasoline refinery margins in the second quarter were 60% higher than a year earlier. Distillate and jet-fuel margins were more than double their year-earlier levels. Those product-market pressures can keep retail prices elevated even when crude futures decline.
Why the Market Is So Sensitive
Roughly one-fifth of the world’s oil and natural gas previously moved through the Strait of Hormuz, according to AP. The waterway’s importance means that even an unverified change in shipping risk can move crude, refined fuels, freight rates, insurance costs, inflation expectations, and interest rates.
EIA’s review of the second quarter shows how extreme the range has been. Front-month Brent reached $118 per barrel on April 29 and fell to $72 on June 26. Average daily price swings in April and May were about $4 per barrel, compared with $1 during the same months of 2025. EIA also estimated that global crude inventories declined by 5.1 million barrels per day in the second quarter, while U.S. commercial stocks ended the quarter at their lowest seasonal level since 2014.
Low inventories make the system less forgiving. If traffic rises and production returns, stocks can rebuild and absorb future disruptions. If negotiations fail, a thin inventory cushion can magnify the price response. That is why the number of safe, completed voyages matters more than a diplomatic headline alone.
Key Numbers
| $4.0801 | AAA national average for regular gasoline, August 5 |
| +$0.2762 | Increase from the national average one month earlier |
| $78.43–$80.45 | Brent snapshots reported during Wednesday’s reversal |
| $118 / $72 | Second-quarter Brent high and low reported by EIA |
| $3.40 | EIA’s conditional forecast for average Q4 gasoline prices |
Household Impact
AAA’s August 5 data show the national average down less than one cent from the previous day and about one cent from a week earlier. That is stabilization, not yet broad relief. Compared with a month earlier, regular gasoline was 27.62 cents higher. Compared with a year earlier, it was 91.63 cents higher.
For illustration, a household buying 50 gallons a month would spend about $13.81 more than at the month-ago national average and about $45.82 more than at the year-ago average. Those are simple volume examples, not estimates for every family. Actual spending depends on location, vehicle efficiency, grade, mileage, and local taxes.
Diesel is an additional pressure point. AAA listed the national diesel average at $5.3622 on August 5, up from $4.7773 a month earlier. That gap feeds into freight, farm operations, construction, and delivery costs. It does not pass through to store prices immediately or uniformly, but it raises the cost base for businesses that move physical goods.
Business, Manufacturing, and Market Impact
A durable decline in energy costs would help airlines, trucking companies, parcel carriers, manufacturers, retailers, and small firms with large vehicle fleets. It could also ease household inflation expectations and reduce pressure on the Federal Reserve to respond to an energy-driven price shock. The benefit would be strongest where fuel is a large share of operating expenses and contracts allow costs to adjust quickly.
Energy producers and oil-service companies face the opposite exposure. Lower crude can reduce revenue and slow drilling plans, especially for higher-cost projects. Refiners are a mixed case: lower crude reduces input costs, but profits depend heavily on the spread between crude and refined-product prices. EIA’s evidence of elevated crack spreads shows why crude alone is an incomplete signal.
Markets should not treat a single-day oil decline as a completed inflation victory. If transportation fuel falls while services inflation, wages, or shelter costs remain firm, the broader price picture may change only modestly. Conversely, a sustained reopening that rebuilds inventories could reduce one of the most visible risks facing consumers and businesses.
Scenario Map
Risk Matrix
Highest immediate exposure: diesel-intensive fleets, airlines, independent truckers, farms, delivery businesses, and households with long commutes.
Mixed exposure: refiners, banks, manufacturers, retailers, and oilfield-service companies; the result depends on margins, contracts, leverage, and inventory.
Potential relative beneficiaries: consumers, transport companies, and rate-sensitive assets if lower energy costs persist long enough to reduce inflation pressure.
What to Watch
- Whether negotiators announce a signed framework, rather than another statement that progress is being made.
https://apnews.com/article/iran-war-us-hormuz-trump-august-5-2026-ecdbd96f2b46c70beb5926d8508f9c55 - EIA’s Weekly Petroleum Status Report for U.S. crude, gasoline, and distillate inventory trends.
https://www.eia.gov/petroleum/supply/weekly/ - AAA’s daily national and state fuel averages for evidence that wholesale moves are reaching drivers.
https://gasprices.aaa.com/ - EIA’s next Short-Term Energy Outlook for revisions after renewed strikes and negotiations.
https://www.eia.gov/outlooks/steo/
Action Checklist
- Track the local pump price, not only national averages or crude futures.
- For a fleet or fuel-heavy business, stress-test costs at today’s diesel price and at a 10% higher price.
- Avoid locking in a large prepaid fuel purchase solely because of one diplomatic headline.
- Review investments for hidden exposure to transport costs, refining margins, or oil-service demand.
- Update the assessment only after confirmed shipping flows and inventory data support the market move.
Choose Our Next Deep Dive
Select a topic to open a ready-to-send email:
Ask the Analyst
Have a question about gasoline, diesel, energy stocks, or the Strait of Hormuz? Send it directly to the American Daily Reports editorial team.
Read Also
American Daily Reports podcasts · Browse the analysis archive
Sources & Methodology
This analysis uses information available at 12:20 p.m. Central European Summer Time on August 5, 2026. Intraday oil prices are snapshots and can change rapidly. AAA fuel prices are daily national averages. EIA figures and forecasts are official statistical estimates; forecasts depend on assumptions and are not guaranteed outcomes.
Associated Press: Trump says a Strait of Hormuz deal could come as early as Wednesday
https://apnews.com/article/iran-war-us-hormuz-trump-august-5-2026-ecdbd96f2b46c70beb5926d8508f9c55
AAA: Daily national gasoline and diesel averages
https://gasprices.aaa.com/
U.S. EIA: July 2026 Short-Term Energy Outlook release
https://www.eia.gov/pressroom/releases/press590.php
U.S. EIA: Petroleum markets and Middle East disruptions in Q2 2026
https://www.eia.gov/Todayinenergy/detail.php?id=67865
U.S. Treasury: Sanctions and maritime-payment risks in the Strait of Hormuz
https://home.treasury.gov/news/press-releases/sb0507